Earthquake prediction, the long-sought holy grail of earthquake science,
continues to confound Earth scientists. Could we make advances by
crowdsourcing, drawing from the vast knowledge and creativity of the
machine learning (ML) community? We used Google’s ML competition
platform, Kaggle, to engage the worldwide ML community with a
competition to develop and improve data analysis approaches on a
forecasting problem that uses laboratory earthquake data. The
competitors were tasked with predicting the time remaining before the
next earthquake of successive laboratory quake events, based on only a
small portion of the laboratory seismic data. The more than 4,500
participating teams created and shared more than 400 computer programs
in openly accessible notebooks. Complementing the now well-known
features of seismic data that map to fault criticality in the
laboratory, the winning teams employed unexpected strategies based on
rescaling failure times as a fraction of the seismic cycle and comparing
input distribution of training and testing data. In addition to
yielding scientific insights into fault processes in the laboratory and
their relation with the evolution of the statistical properties of the
associated seismic data, the competition serves as a pedagogical tool
for teaching ML in geophysics. The approach may provide a model for
other competitions in geosciences or other domains of study to help
engage the ML community on problems of significance.
VIDEO: The phase and libration of the Moon for 2021, at hourly intervals. Includes supplemental graphics that display the Moon's orbit, subsolar and sub-Earth points, and the Moon's distance from Earth at true scale. Craters near the terminator are labeled, as are Apollo landing sites and maria and other albedo features in sunlight [LRO/NASA's Scientific Visualization Studio]
• Lunar Reconnaissance Orbiter (LRO) has been in orbit around the Moon since the summer of 2009. Its laser altimeter (LOLA) and camera (LROC) are recording the rugged, airless lunar terrain in exceptional detail, making it possible to visualize the Moon with unprecedented fidelity. This is especially evident in the long shadows cast near the terminator, or day-night line. The pummeled, craggy landscape thrown into high relief at the terminator would be impossible to recreate in the computer without global terrain maps like those from LRO.
The Moon always keeps the same face to us, but not exactly the same face. Because of the tilt and shape of its orbit, we see the Moon from slightly different angles over the course of a month. When a month is compressed into 24 seconds, as it is in this animation, our changing view of the Moon makes it look like it's wobbling. This wobble is called libration.
The word comes from the Latin for "balance scale" (as does the name of the zodiac constellation Libra) and refers to the way such a scale tips up and down on alternating sides. The sub-Earth point gives the amount of libration in longitude and latitude. The sub-Earth point is also the apparent center of the Moon's disk and the location on the Moon where the Earth is directly overhead.
The Moon is subject to other motions as well. It appears to roll back and forth around the sub-Earth point. The roll angle is given by the position angle of the axis, which is the angle of the Moon's north pole relative to celestial north. The Moon also approaches and recedes from us, appearing to grow and shrink. The two extremes, called perigee (near) and apogee (far), differ by as much as 14%.
The most noticed monthly variation in the Moon's appearance is the cycle of phases, caused by the changing angle of the Sun as the Moon orbits the Earth. The cycle begins with the waxing (growing) crescent Moon visible in the west just after sunset. By first quarter, the Moon is high in the sky at sunset and sets around midnight. The full Moon rises at sunset and is high in the sky at midnight. The third quarter Moon is often surprisingly conspicuous in the daylit western sky long after sunrise.
Celestial north is up in these images, corresponding to the view from the northern hemisphere. The descriptions of the print resolution stills also assume a northern hemisphere orientation. (There is also a south-up version of this page. (Link Below)
A 457-metre long “data treasure” in the shape of a drilling core from
the Dead Sea provides a unique insight into past earthquake history.
These findings are essential for improving seismic hazard assessment.
Yin Lu is an expert in the field of paleoseismology and has recently
joined the Sedimentary Geology research group at the Department of
Geology.
Earthquakes are among the most devastating natural
disasters on our planet. Especially large earthquakes with a magnitude
above 7 are very dangerous. In order to understand the dynamics behind
earthquakes, a look into the past is essential. However, this look does
not go very far, as reliable seismological recordings only reach back
about 100 years, and historical data are not sufficient in this respect.
Researchers therefore rely on drilling cores from sediment deposits
from the deep sea or even lakes to obtain precise data from prehistoric
times. “The different sediment layers that are deposited year after year
on the floor of our lakes and oceans provide long-term information on
climatic and ecological conditions, but also record the disturbances
induced by strong earthquake shaking that happened long ago, in the
prehistoric past. Knowledge about these past events can help better
understand earthquake occurrence and provide key information for
assessing future earthquake hazard,” says Prof. Michael Strasser, head
of the Sedimentary Geology working group at the Department of Geology
and the Austrian Core Facility for scientific core analysis at the
University of Innsbruck. “In light of this, the core from the Dead Sea,
which my colleague Yin Lu is now analysing in Innsbruck, is a fantastic
data set and very valuable for our research work.”
Dead Sea Archive
The
Dead Sea Fault between the African and Arabian plates is one of the
most famous earthquake-generating faults on earth. The Dead Sea is
located approximately in the middle of this fault and, with 434 metres
below sea level, is the lowest place on earth. Ten years ago, an
international continental drilling program (ICDP) operation was carried
out there to drill a core from the 300-metre-deep Dead Sea, which is 457
metres long and covers a period of 220,000 years in its sediments.
“From the structures of the mud deposits, we can see when severe
earthquakes took place and how strong these were ,” says Yin Lu.
Lu
has been working at the Department of Geology since October 1, 2020,
where he will be conducting research on different types of
earthquake-related structures in this drilling core over the next few
years as part of the Austrian Science Fund’s (FWF) Lise Meitner
programme in the “DeadSeaQuakeRec” project, hosted by Ass. Professor
Jasper Moernaut. Yin Lu has already worked intensively on this topic
during his time at the Department of Geophysics at Tel Aviv University.
First results were recently published in the journal Science Advances.
Strong earthquakes in short intervals
Together
with international colleagues, Yin Lu identified more than 400
sedimentary deformations in the drilling core that indicate earthquake
events. First results were recently published in the journal Science
Advances. “Strong earthquakes are rare. However, since instrumental
records do not go back very long, we know little about a possible cycle
of strong earthquakes,” explains Lu. “In the sedimentary deposits from
the Dead Sea, we can see a strikingly irregular recurrence of large
earthquakes within the last 220,000 years, and this with a mean return
time of of less than 1400 years. This rhythm is significantly shorter
than previously considered and thus the seismic hazard in this region is
underestimated. Up until now, research has assumed that strong
earthquakes occur approximately every 11,000 to 7,000 years,” the
geologist describes one of the main findings of the recent study. The
work on this “fossil seismograph” will be continued intensively in the
coming years. The researchers already have several plans for future
research work during Yin Lu’s stay: “For example, we will analyse this
unique record with ultra-high resolution core scanners and also relate
our findings to climatic developments that have led to drastic lake
level changes at the Dead Sea, ” Jasper Moernaut adds.
Earthquake magnitudes may seem
straightforward, but a lot goes into their calculation, and multiple
methods can be used. These methods must account for many complications,
like the impacts of local geology on the amplitude of shaking. In
Yellowstone, a modern seismic network and experienced analysts make it
possible to determine the magnitudes of even the smallest earthquakes!
Yellowstone Caldera
Chronicles is a weekly column written by scientists and collaborators
of the Yellowstone Volcano Observatory. This week's contribution is from
David Shelly, seismologist with the U.S. Geological Survey, and Jamie
Farrell and James Pechmann, seismologists with the University of Utah.
How do seismologists determine the size of an earthquake? This sounds
like a simple question, and it is a fundamental task of earthquake
monitoring in Yellowstone and elsewhere. Although simple in concept, in
practice measuring the magnitude of an earthquake can be quite
challenging. It’s not as easy as making the earthquake stand on a scale
and reading the dial. In fact, methods to compute earthquake
magnitudes have evolved considerably over the years and continue to
evolve today.
From Richter's (1958) book, Elementary Seismology.
(Public domain.)
The first earthquake magnitude scale
was invented by Charles Richter for southern California in 1935.
Unlike seismic intensity, which measures the strength of shaking and
varies according to distance from the quake and other factors, the
magnitude is intended to measure the intrinsic size of an earthquake.
The “Richter scale” (also known as “local magnitude” or ML)
assigns a magnitude based on the distance from the source and the
recorded amplitude on a particular type of seismograph used in Richter's
day. Richter adapted the concept of magnitude from astronomy,
including the use of a logarithmic scale to characterize the huge range
of earthquake sizes. In a logarithmic scale, magnitudes separated by 1
on the scale are 10 times different in their amplitude—a magnitude-4
earthquake is 10 times larger in amplitude than a magnitude 3, for
instance. But Richter reversed the direction such that larger
magnitudes indicated larger earthquakes (whereas in astronomy, smaller
magnitudes indicate brighter stars).
The Richter scale was an important development, but there were
problems. First of all, the scale saturates for the largest
earthquakes—that is, the scale is unable to accurately distinguish
between an earthquake of magnitude about 7.0 and one that is in fact
much larger. The other problem is that geology varies among different
regions, meaning that the rocks may absorb differing amounts of energy
between the earthquake source and the seismic station where the
earthquake is recorded. Because of this variability, the method for
determining Richter magnitudes usually must be modified for use in
regions outside southern California.
To solve these problems, scientists developed a new magnitude scale called moment magnitude, sometimes written Mw.
Unlike the Richter scale, moment magnitude is based on a physical
quantity of the earthquake source, the seismic moment, which represents
the average fault slip multiplied by the area over which the slip occurs
and by the stiffness of the surrounding rocks. The equations are written such that ML and Mw
magnitudes are roughly comparable. Moment magnitude has now replaced
the Richter scale as the standard for measuring large earthquakes
worldwide (above about magnitude 5), and it is sometimes calculated down
to about magnitude 3 in places where seismic networks are dense and
high quality. But Mw has challenges—it's slower and more involved to calculate than other magnitudes like ML,
requiring careful modeling of the earthquake waveforms. And smaller
earthquakes are not readily amenable to this type of processing,
although determining Mw for smaller earthquakes is an area of current research.
Earthquakes in the Yellowstone area are monitored by the University of Utah Seismograph Stations (UUSS) in partnership with the U.S. Geological Survey. In addition to ML and Mw, UUSS also uses a scale called “coda magnitude” (Mc)
to characterize earthquakes in the region. This magnitude measurement
is based on how long it takes for the seismic energy to return to
background levels after the earthquake. Mc is designed to be compatible with ML.
Map of seismic stations in the Yellowstone region, with numbers of
channels indicated by number and sensor type by color. Inverted
triangles indicate stations operated by University of Utah Seismograph
Stations (UUSS), and squares indicate stations operated by other
agencies.
(Public domain.)
Sometimes an earthquake may be initially reported with either ML or Mc magnitude types, before being later updated to Mw.
In addition, an earthquake magnitude of the same type is sometimes
revised later after more data become available or the data are
re-analyzed more thoroughly. The numerical magnitude may change in this
process, but the magnitude changes are usually small. Seismologists are
continually working to improve methods used to measure earthquake
magnitude, while also maintaining consistency with earlier monitoring.
Long-term investments in monitoring infrastructure at Yellowstone,
including increased density and quality of seismometers, have paid
dividends by providing better estimates of earthquake locations and
magnitudes, not to mention the ability to detect increasingly small
earthquakes. Scientists use this information, in combination with other
monitoring data, to infer what’s happening within the volcanic system
of Yellowstone and its neighboring faults. Earthquake data are
particularly valuable because seismic waves emanate from deep
underground, where we have few other direct measurements.
So, the next time you hear about an earthquake (or feel one
yourself!), you can ask, “How big was that earthquake...on the moment
magnitude scale?”
Jupiter and Saturn Will Form a Rare 'Double Planet' in the Sky Before Christmas. Here's how to see an incredible spectacle that hasn't happened in 800 years. It’s the first time since the middle ages the planets have aligned this close.
You can see this planetary conjunction on the winter solstice, December 21. The last time Jupiter and Saturn appeared this close was in 1623, just 14 years after Galileo made his first telescope and discovered the moons of Jupiter. You won’t see similar conjunction this close again until March 15, 2080. The German astronomer Kepet in 1614 that the conjunction of Jupiter and Saturn occurring in 7 B.C. may be what the three wise men in the Nativity Story called the Star of Bethlehem. Whether the famed “Christmas Star” was a real astronomical event, like planetary conjunction or comet, remains a mystery.
HONOLULU — Staff at Puerto Rico's iconic Arecibo Observatory are monitoring the facility for potential damage in the midst of a spate of earthquakes rocking the island.
The strongest of those quakes was a 6.4 temblor
early in the morning of Tuesday (Jan. 7). An initial survey conducted
by drone after that event found no damage to the massive radio dish or
the equipment above it, an Arecibo Observatory representative said here
at the 235th meeting of the American Astronomical Society on Tuesday (Jan. 7).
However,
safety protocols mean that observatory personnel can't examine the dish
or its accessories until the ground stops shaking, and it's difficult
to predict when that will happen.
The earthquake swarm arrived just as Arecibo Observatory was preparing to embark on a year full of repairs to damage caused by Hurricane Maria,
which battered Puerto Rico in 2017. The observatory has been conducting
science work in the wake of the storm, but the new data has not been of
the same quality as that gathered before the hurricane.
Then, on Dec. 28, 2019, the ground started shaking. According to a statement released by the U.S. Geological Survey,
the area has experienced more than 30 earthquakes of magnitude 4 or
stronger since that date; the same time period has subjected the region
to more than 500 smaller shakes. The agency added that the federal
government repaired earthquake sensors after Hurricane Maria and has
also shipped more detectors to the island since the swarm of quakes
began.
Arecibo Observatory is one of the key facilities in the
U.S. for monitoring nearby asteroids. That work relies on shooting such
space rocks with a radar beam, then measuring the light that bounces
back. Such observations can tell scientists about an asteroid's size, shape and composition, giving planetary defense experts a better sense of whether the rock poses a collision risk.
Rumbling quakes on the red planet have
been traced back to Cerberus Fossae, suggesting this geologically young
region is still alive and cracking.
Several deep fractures cut across Mars's cratered surface in this
image taken in January 2018 by the European Space Agency's Mars Express
orbiter. These gashes are part of the Cerberus Fossae system near the
Martian equator.
Millions of miles away, a
robot geologist stands alone on the dusty surface of Mars, listening for
faint seismic echoes in the ground below. It’s finger on the red
planet’s pulse is sensitive enough to pick up the whoosh of wind, the
drone of dust devils, the creak of tectonic cracks, and many other
rumbles ricocheting though the planet’s insides.
While most of these signals have been indistinct murmurs, two have
stood out loud and clear, allowing scientists to trace them back to
their source: the first active fault zone yet found on the red planet.
Known as marsquakes, the events clocked in between magnitude 3 and 4, according to data from NASA’s InSight lander presented at a recent American Geophysical Union conference.
While the two quakes are small by Earth standards, they’re among the
largest yet detected on Mars. Scientists were able to trace both quakes
to an area known as Cerberus Fossae, a series of deep gashes that
lingers some 994 miles to the east of InSight’s landing zone.
The results from this work are pending publication in a peer-reviewed
journal, and scientists associated with the InSight team declined to
comment until after the study’s release. But the announcement of this
active fault zone millions of miles away already has earthbound
scientists abuzz. (Find out how Mars experts are also investigating mysterious magnetic pulses felt by InSight.)
“All the expectations we have and all the models we have to try to
explain how active Mars might be can now be benchmarked against this
measurement,” says Paul Byrne,
a planetary geologist at North Carolina State University who is not
part of the InSight team. “Mars has just become a bit more alive to us
with these data.”
It’s unclear if or how this find might influence decisions for future human settlements on the red planet.
The activity could point to a potentially useful source of geothermal
energy on Mars, while the seismic shaking—which would feel akin to a big
truck rumbling by—might pose an issue for sensitive scientific
instrumentation, says Tanya Harrison,
a planetary scientist specializing in Mars who is currently an account
executive at the satellite company Planet Federal. Overall, however,
other perils likely pose greater risk for future Mars adventurers, Byrne
notes.
More immediately, the marsquakes are a promising sign for what’s
still to come from the InSight mission, which aims to untangle Mars’
current tectonic activity, as well as use the tiny trembles to map out
the planet’s interior, similar to how an ultrasound can peer inside our
bodies.
“It’s a huge deal for Mars science,” Harrison says. “It’s totally mind blowing.”
Geologic gashes
The robotic emissary known as InSight landed on Mars in November 2018 carrying “the most sensitive seismometer we’ve ever put on a planet, as far as I know,” says Christine Houser,
a global seismologist at the Earth-Life Science Institute at Tokyo
Institute of Technology. It not only detects “every creak and moan in
the crust,” she says, but also many changes in atmospheric conditions. A
suite of accompanying detectors can measure atmospheric pressure, wind
speed, temperature, and more, helping to tease out what’s a marsquake
and what’s not.
While much of what InSight’s seismometer has heard so far is the roar
of the wind, there are a few hours after sunset when the bluster quiets
down and other signals emerge. InSight detected its first seismic
rumble from the planet’s interior, rather than its noisy surface, on
April 6, 2019. (Learn more about the first marsquake ever recorded on the red planet.)
Since that time, temblors have been happening with increasing
frequency—with more than 300 yet detected. But more monitoring is
necessary to figure out why.
Scientists are also unsure what mechanism is causing the various
internal rumbles on Mars. On Earth, quakes frequently come from the
never-ending movement of tectonic plates as they jockey for position.
This geologic dance builds up stress in our planet’s crust that
occasionally hits a breaking point. When this happens, the land can
suddenly shift, sending out a jolt in the form of an earthquake. (Here’s what'll happen when plate tectonics grind to a halt.)
Mars, however, doesn’t have plate tectonics. After its formation, the
planet was a searing mass of molten rock that eventually cooled to form
a static crust around a rocky mantle,
yet it’s unclear how hot the planet’s insides are today. While
volcanoes once gushed lava at its surface, they have long since fallen
silent. But scientists suspect that pockets of magma might still linger
below, since its stationary crust may act like a lid on a steaming cup
of coffee, retaining heat from the planet’s formation, Houser explains.
In that case, some marsquakes might be due to the rocky planet’s
ongoing cooling and contraction. This compression could crack the
surface in so-called thrust faults, in which one block of land is shoved
atop another. Still others might come from magma or water squishing
through the Martian subsurface.
Gurgling from below
What exactly is causing the latest activity at Cerberus Fossae is
uncertain without more data from the InSight team, Byrne says, but the
region’s history provides some clues.
Ancient cave art may depict the world's oldest hunting scene
Cerberus Fossae is thought to be among the youngest fault zones on the red planet, opening up as little as 10 million years ago or less.
The geologic newness is evidenced by deep valleys that cleanly cut
through the pockmarks of more ancient craters, with sharp, near-vertical
walls that are not yet worn down by time. Hints of geologically recent
activity also remain: Multiple boulders around the area seem to have
been shaken from their original position, leaving behind trails in the Martian dust.
These deep gashes may have formed due to a rising blob of magma—perhaps tied to the towering, if dormant, volcanoes to the northwest—which
forced the landscape to stretch and crack. Some of these breaks even
seem to have once spouted their own vast sheets of molten rock.
“The detected seismic events might suggest that the crack formation is still ongoing,” Misha Kreslavsky, a planetary scientist at the University of California, Santa Cruz, who is not part of the InSight team, writes via email.
Other sections of the cracked surface lead to landscapes seemingly sculpted by the rush of floods,
so it’s possible that some type of water gurgling below this region
could alternatively be the cause of the quakes, Byrne speculates, though
he also thinks magma is a plausible culprit.
No matter their source,
though, the quakes offer exciting hints that Cerberus Fossae isn’t
necessarily dead: “The history of that area is continuing to be written
today,” Byrne says. “That’s just—wow.”
When an earthquake occurs, stress accumulated in solid rock is suddenly released along fault lines. The energy released when the rocks break along the fault is converted into seismic waves that radiate from the origin.
How much energy is involved largely depends on the magnitude of the quake: larger quakes release much, much more energy than smaller quakes.
The Richter magnitude scale was devised by Charles F. Richter in 1935
to classify local earthquakes in southern California, but has evolved
into the most common parameter to describe the size of the quake and
hence, its energy and potential of destructive power.
It is logarithmic, meaning that an increase of 1 corresponds to a
10-fold increase in the amplitude of the seismic waves generated, which
shake the ground. It can also be used to estimate the released energy of
a quake, following the Gutenberg-Richter magnitude-energy relation:
log E = 1.5×R + 4.8
or equivalently:
E = 101.5×R + 4.8
The relationship also involves that an increase of 1 in magnitude results in an approx. 30-fold increase in energy.
Seismic energy by magnitude compared:
Magnitude
Energy in joules (J)
Wh
TNT equiv.
Notes
-2.0
63
0.0000175 KWh
near 0
1 kg dropped 6.30 m
-1.0
2000
0.00056 KWh
0.5 g of TNT
100 kg person jumps down 2 m
0.0
6.3 x 10⁴
0.0175 KWh
15 g of TNT
60W light bulb turned on for 17 mins
1.0
2.0 x 10⁶
0.56 KWh
0.5 kg of TNT
60W light bulb turned on for 9 hrs
2.0
6.3 x 10⁷
17.5 KWh
15 kg of TNT
Only felt nearby
60W light bulb turned on for 12 days
3.0
2.0 x 10⁹
556 KWh
0.5 tons of TNT
Energy from 50 liters of petrol
4.0
6.3 x 10¹⁰
17.5 MWh
15 tons of TNT
Annual energy consumption of 4 average UK households (US: 1.5)
Often felt up to 10s of km distance
5.0
2.0 x 10¹²
556 MWh
500 tons of TNT
Energy from 50,000 liters of petrol
Annual energy consumption of 47 average US households
6.0
6.3 x 10¹³
17.5 GWh
15 kilotons of TNT
1945 Hiroshima bomb
Annual energy consumption of 1500 average US households
7.0
2.0 x 10¹⁵
556 GWh
500 kilotons of TNT
Annual energy consumption of 47,000 average US households
8.0
6.3 x 10¹⁶
17.5 TWh
15 million tons of TNT
1–2 earthquakes this size each year
Total annual energy use of Cuba
9.0
2.0 x 10¹⁸
556 TWh
500 million tons of TNT
Total annual energy use of UK
Some facts about earthquake energy:
A
single magnitude 8+ quake typically releases more energy than all other
earthquakes combined during the same year (if no other quakes of
similar magnitude occur).
Magnitude 9+ quakes occur only every few years to decades on
average, but account for significant part of the total seismic energy
released during whole centuries.
The largest recorded earthquake in history was the so-called
"Great Chilean Earthquake" or "Valdivia Earthquake" which occurred on
May 22, 1960 near Valdivia, in southern Chile. It had a magnitude of
9.5, which is also near the largest theoretically possible value. It
accounts for about 30% of the total seismic energy released on earth
during the last 100 years.
For example, the 14th November 2019 7/0R in Indonesia, released energy as follows:
Date & time: Thursday, 14 November 2019 16:17 UTC
Magnitude: 7.0
Depth: 27.0 km
Epicenter latitude / longitude: 1.6°N / 126.36°E (Indonesia)
Nearest volcano: Todoko-Ranu (127 km)
Primary data source: GFZ
Estimated released energy: 2*10^15 J (554 GWh / 4.8*10^5 tons of TNT / 29.8 atomic bombs equivalent)
This is just a pictorial map of the planets relative to each other in our planetary system. Today, 21st November, notable is Jupiter-Venus-Earth align and can be activated 6R as it did early today.
Thousands of migratory birds of about ten species were found dead
around Sambhar Lake, India’s largest inland saltwater lake near Jaipur.
Officials suspect water contamination as one of the reasons for the deaths.
Officials report 1,500 carcasses while locals say there are more than 5,000 dead birds.
“We have never seen anything like that. Over 5,000 birds died mysteriously all over the place,”
said 25-year-old Abhinav Vaishnav, a local bird-watcher as he
discovered with some of his friends the bodies of hundreds of lifeless
migratory birds last Sunday.
Officials said they suspect water contamination as one of the reasons for the deaths but were awaiting viscera test reports.
Hailstorm? Bird Flu? Water Contamination? Increased Salinity?
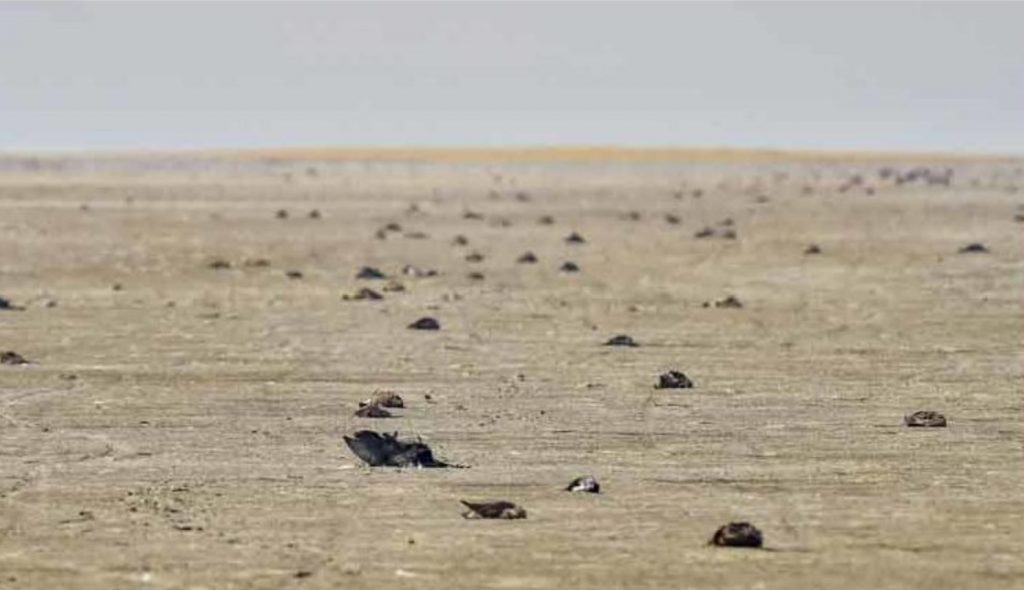
Carcasses of thousands of dead birds including plovers, common coot,
black winged stilt, northern shovelers, ruddy shelduck, and pied avocet
were scattered on the edge of 12-13 km of the catchment area of the
lake.
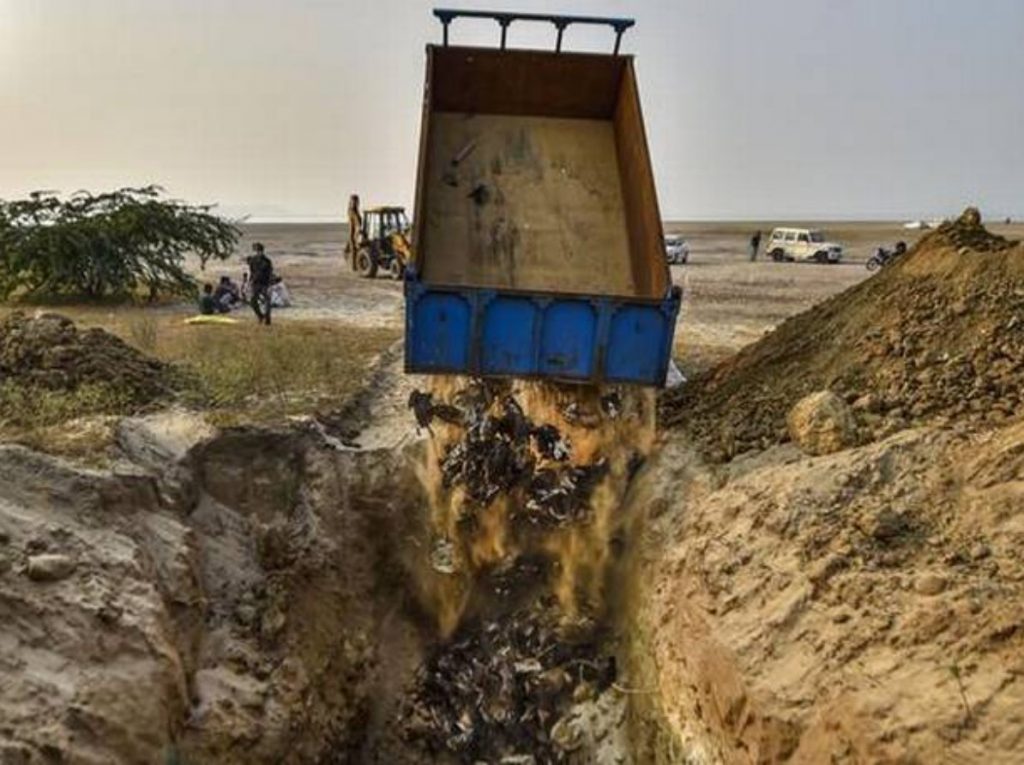
The dead birds were collected and dumped in a massive pit. Picture PTI via The Hindu
Forest ranger Rajendra Jakhar said a possible reason could be a
hailstorm that hit the area a few days back, as recently reported in Montana, South Africa or India again.
“We estimate about 1,500 birds of about 10 species have
died. We are also looking at other possibilities like toxicity of the
water, bacterial or viral infection,” he said.
housands of birds found dead on the shore of the largest salt lake in India. Picture via Youtube video
Bird flu has already been ruled out by veterinarians: “At
initial examination we did not find any sort of secretion from the
birds, which is a giveaway in the cases of bird flu. However, the water
may have been contaminated.
Increased salinity of the water could also be another reason, as
enhanced salt concentration in the blood can slow down the blood flow
sometimes leading to a collapse of internal organs and of the brain.
A medical team from Jaipur has collected a few carcasses and water samples have been sent to Bhopal for further toxicological examination.
Mysterious Bird Mass Die-Off Perplexes Locals and Officials
Every year, the lake hosts approximately 50,000 flamingos and 1,000,000 waders.
The strange mass die-off event has left villagers and officials baffled for the lack of a sensible explanation.
One of the thousand birds found dead in India. Picture PTI via The Hindu
“I have never seen such a thing in 40 years of loyal
service for the forest department. First I thought it could be because
the result of hail, but that occurs every year. There is no chemical
waste in this water either,” said Ramesh Chandra Daroga, a local working with the forest department.
This is the second such unexplained incident in the state within a
week after 37 demoiselle cranes were found dead in Jodhpur’s Khinchan
area last Thursday.
Meanwhile, the carcasses are being collected and buried in a ditch. What is the reason behind this horrifying bird mass die-off?
French utility EDF on Tuesday extended outages at three nuclear reactors
at its Cruas plant until Nov. 15 following a 5.1 magnitude earthquake
in southeast France that forced it to temporarily suspend electricity
generation at the site.
A sensor at the plant was activated during the earthquake in the region on Monday, requiring the state-controlled utility to carry out further checks for potential damage.
A spokesman for EDF
said the outage extension would allow enough time for thorough visual
and advanced checks across the plant, including in the nuclear buildings
to ascertain that the units could function properly when they
restarted.
France’s ASN nuclear safety agency on Monday said it was monitoring the situation and would decide when the reactors could restart.
The outage at the three reactors reduced French power generation by 2,700 megawatts (MW).
European
wholesale power prices for day-ahead delivery surged to their highest
level in 9-1/2 months on Tuesday on tight supply concerns following
EDF’s decision to halt the reactors.
France’s day-ahead spot power
price soared 24.3% in early trade to 60 euros ($66) a megawatt hour
(MWh), due to the reactor outage.
A spokeswoman for French
electricity grid operator RTE, said France had enough generation
capacity to cover demand on Tuesday despite the sudden outage.
A new understanding of a fault that caused a deadly 7.8 magnitude
earthquake can help scientists better understand where and when the next
big one will hit.
For decades, scientists have debated the structure of the Main Himalayan Thrust—the fault responsible for a 2015 earthquake
that killed nearly 9,000 people, injured 22,000, and destroyed 600,000
homes in Gorkha, Nepal. This fault is a direct result of ongoing
collision between two tectonic plates—the Indian and Eurasian—that gives rise to the Himalayas.
Led by UC Riverside, a team of researchers has determined a new
geometric model for the fault that will allow officials to better
prepare for future shakers. The team's work is detailed in a paper
published today in Nature Geoscience.
"This is the most high-resolution model of this fault structure to
date," said Abhijit Ghosh, a UCR associate professor of geophysics.
"With this knowledge we can better explain why the quake happened the
way it happened, and better estimate the stress points along the fault
that may act as birthplaces for future large damaging earthquakes."
Following the quake, Ghosh and his collaborators rushed to Nepal to
operate a network of 45 seismometers in the ground. Their journey was
complicated by the difficulty of traveling in that high-altitude, rocky
region as well as the timing of the quake during monsoon season.
Despite the difficulties, the team pushed through because the
existing network of aftershock-measuring devices, known as seismic
stations, was very limited. Without data on the aftershocks, such as
their locations and magnitude, it would not have been possible to
develop a more detailed understanding of the fault.
"The geometry of the fault also matters," Ghosh said. "It's critical
to look at smaller earthquakes and aftershocks to determine where the
stress points are in a fault. Fault geometry plays a major role in earthquake generation."
It is also critical to learn the shape of a fault, as well as
earthquake "style," meaning the ways in which a block of rock moves
relative to other rocks during an earthquake.
The team found that the Himalayan Thrust, which runs more than 1,000
kilometers from Pakistan to Myanmar, is built in a shape known as a
duplex in the area where the magnitude 7.8 earthquake occurred in 2015.
"It consists of two horizontal planes connected by a complex
structure bounded by many not-quite-horizontal faults," Ghosh explained.
This study was funded by the National Science Foundation. The first
author of the paper is Matt Mendoza, a Ph.D. student in the Ghosh
Earthquake Seismology lab at UCR. Partners included the Government of
Nepal's Department of Mining and Geology, as well as researchers from
Stanford University, the University of Texas, El Paso, and the
University of Oregon.
The team concluded the fault is still accumulating stress, and that
the 2015 event may have increased the likelihood of another big
earthquake nearby. This last point may be of interest to Californians.
Accumulated stress from the Nepalese earthquake may be adding stress
to parts of the underlying fault that haven't ruptured yet, and the same
may be true of faults in Southern California.
In particular, Ghosh is interested in the aftermath of a magnitude
7.1 earthquake that hit Ridgecrest, Calif., on July 5. The 150-mile-long
Garlock fault lies perpendicular to the one that caused the Ridgecrest
quake and could produce an even larger and more damaging earthquake.
Those residing anywhere near major fault lines should always have an
emergency plan and supplies on hand because earthquakes are inevitable.
"The moral of this story is if you live anywhere near a fault, get your earthquake kit ready," Ghosh said. "That is always the moral of the story."
Millions felt the shaking from the Ridgecrest earthquake.
But it’s only watching those new satellite images that you will understand how California’s biggest earthquake in nearly two decades caused the ground to break.
This California Meadow Transforms Into Sea Of Luminescent 'Flowers' At Night
featured by
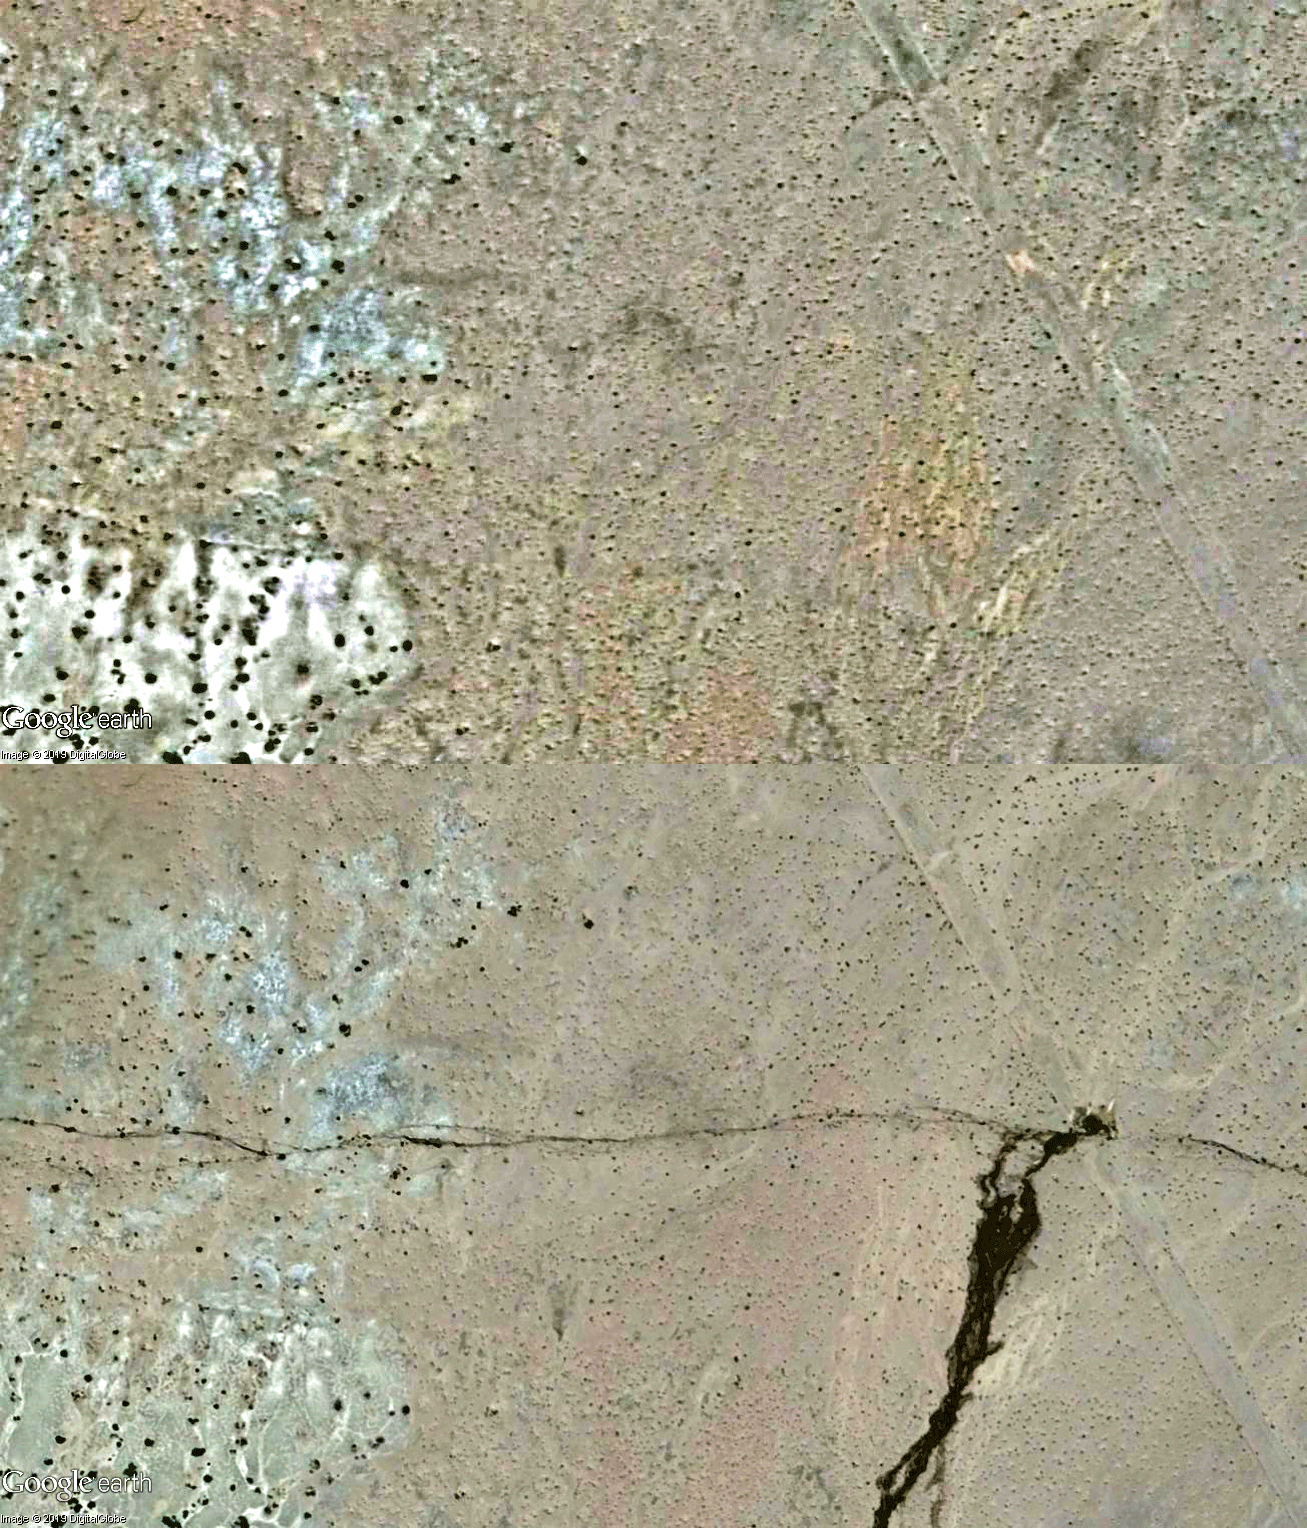
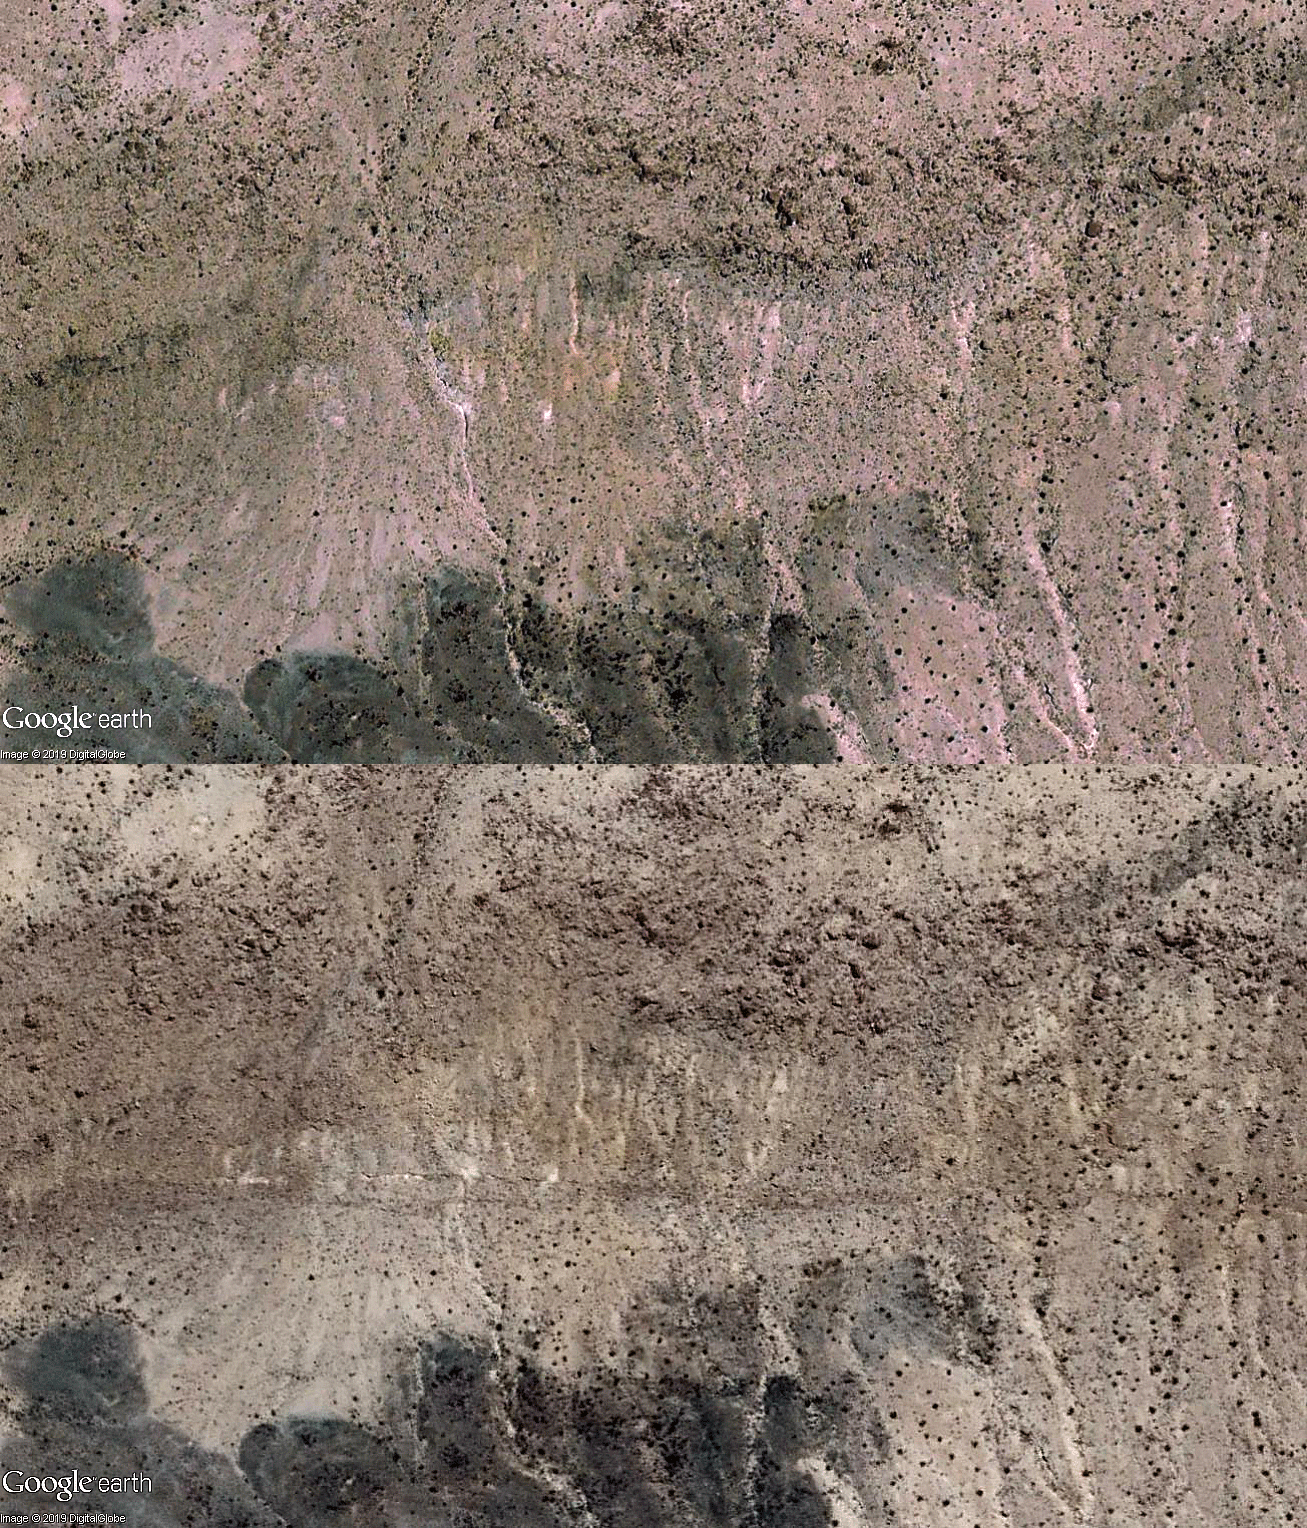
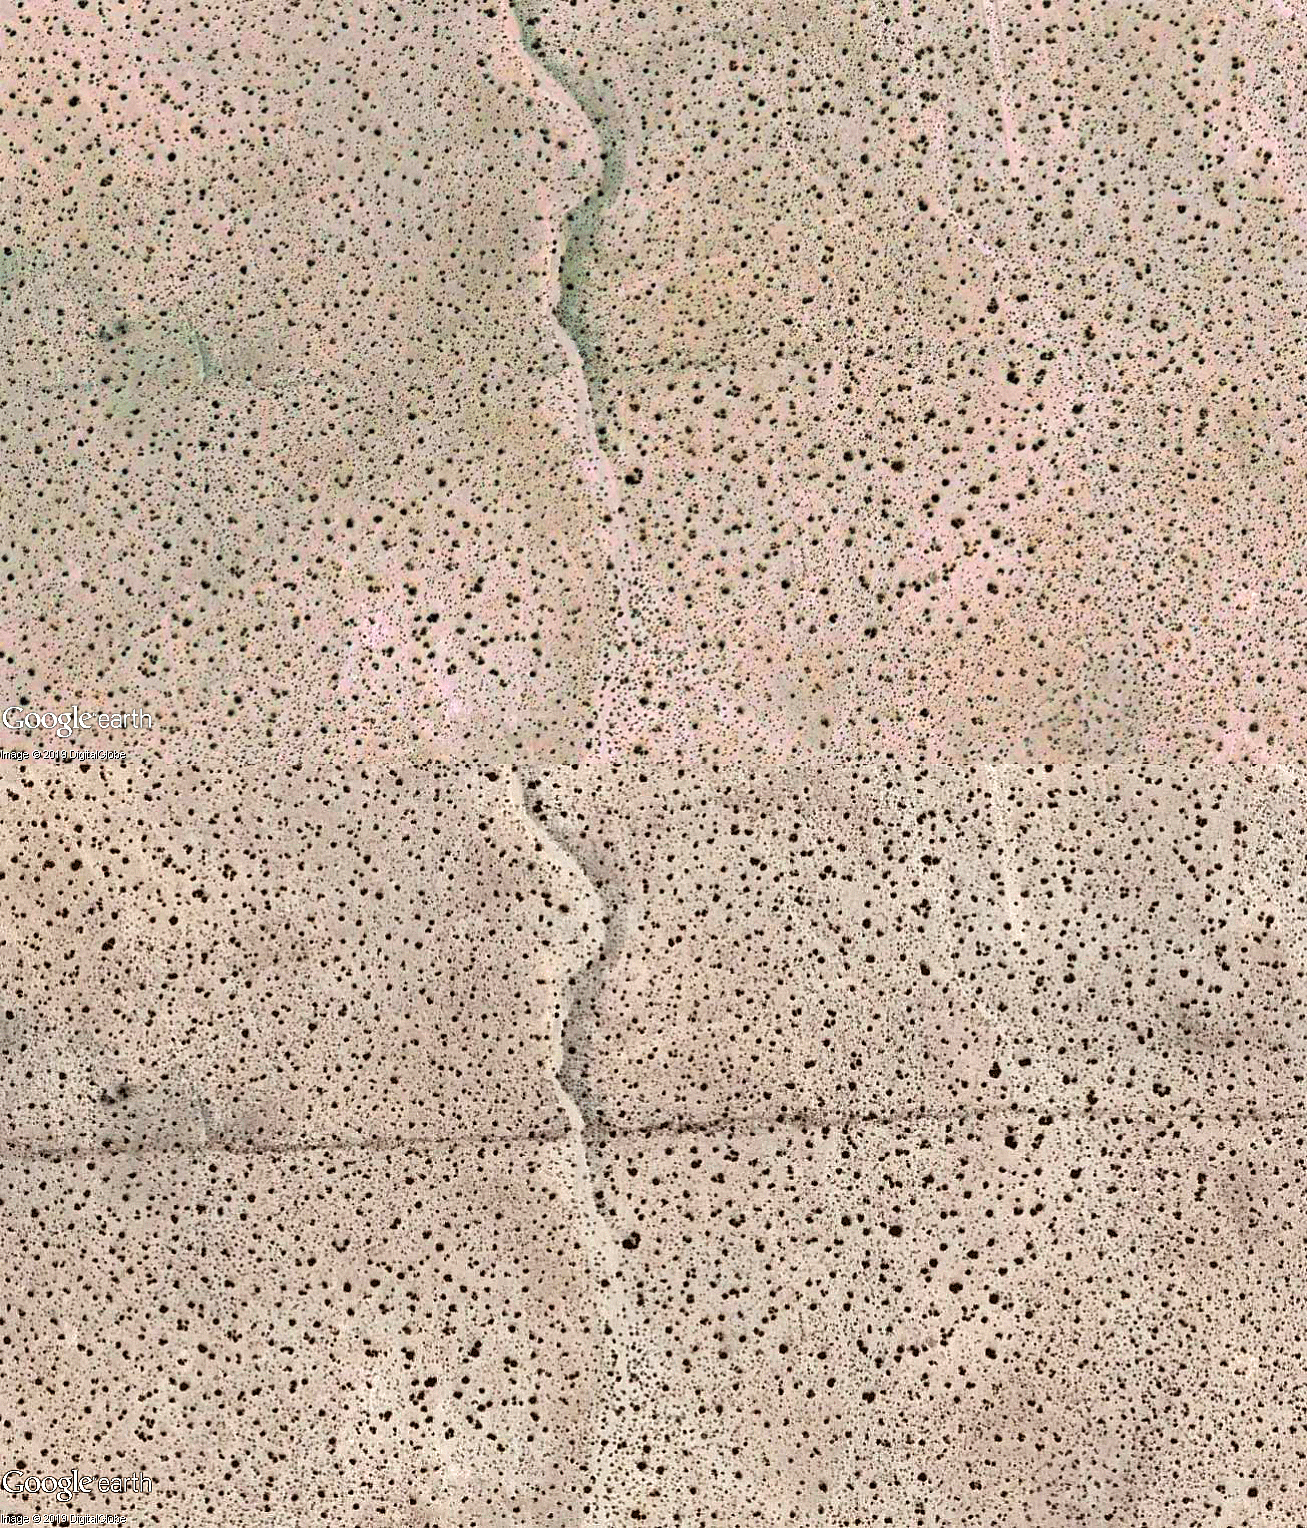
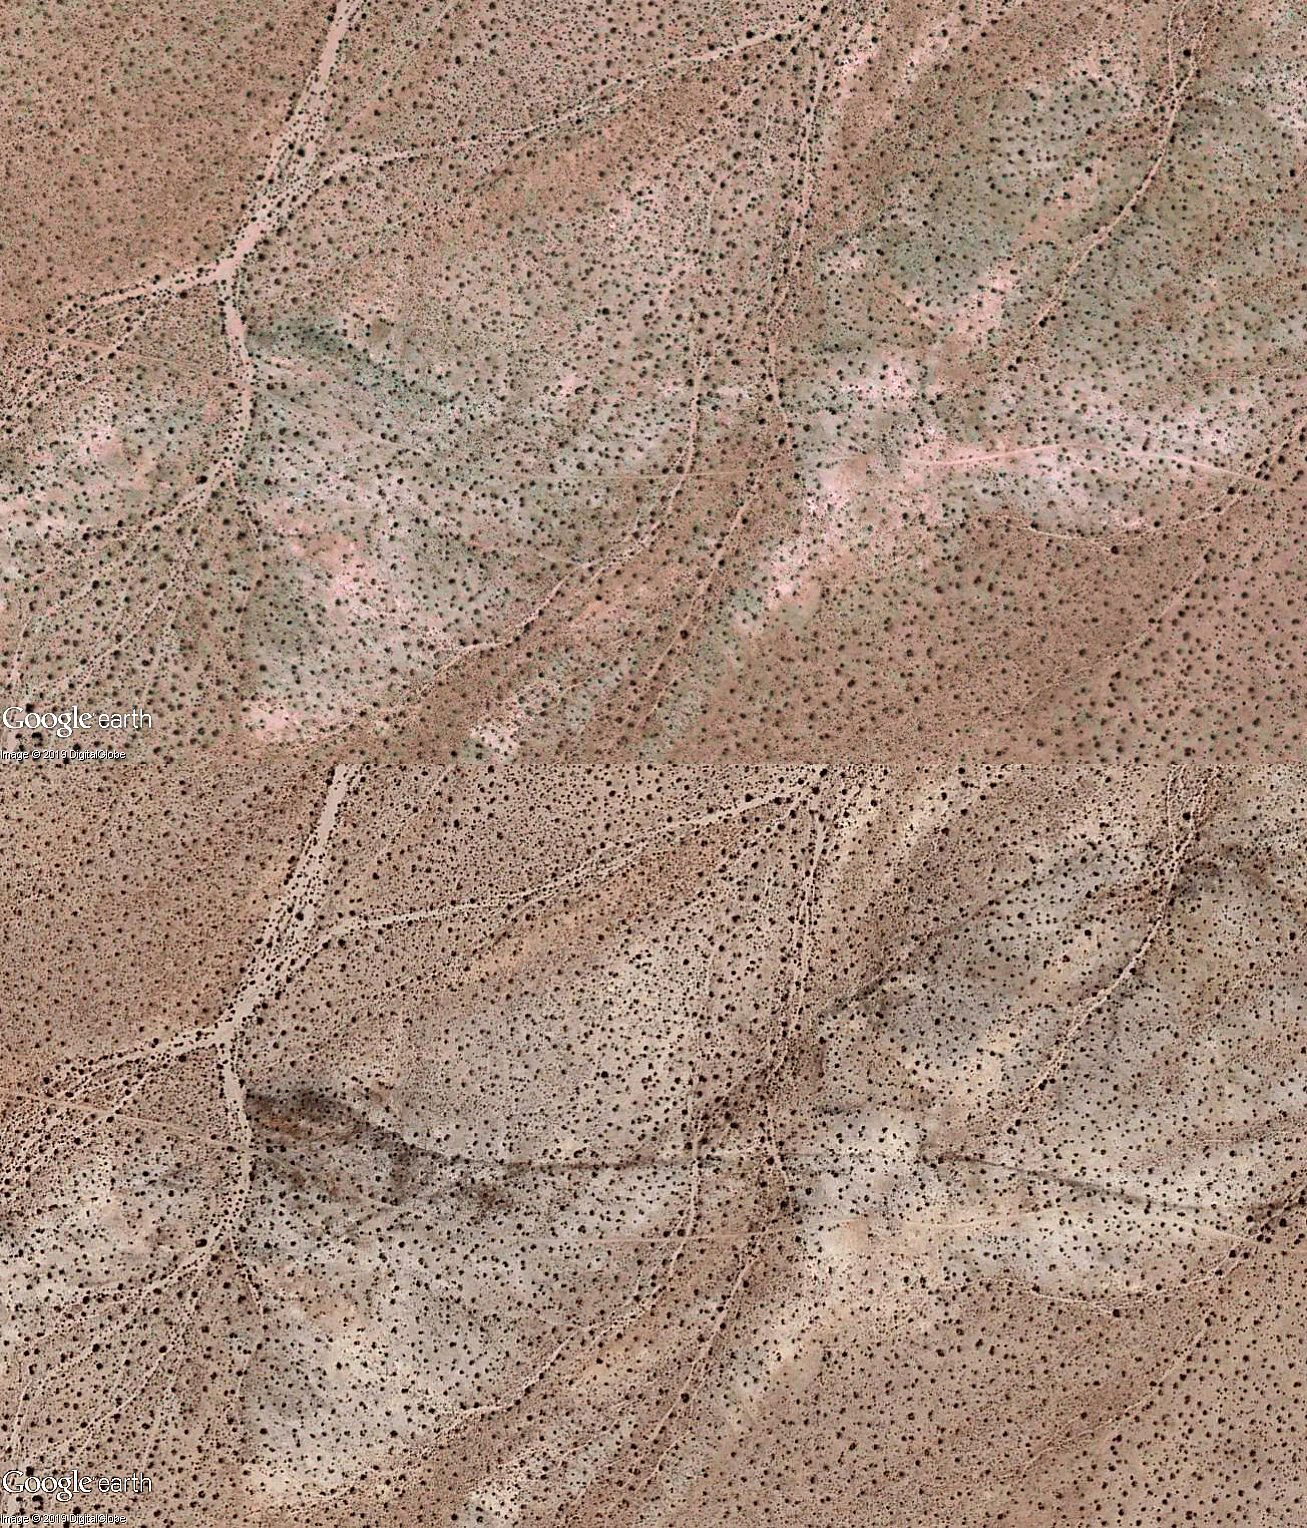
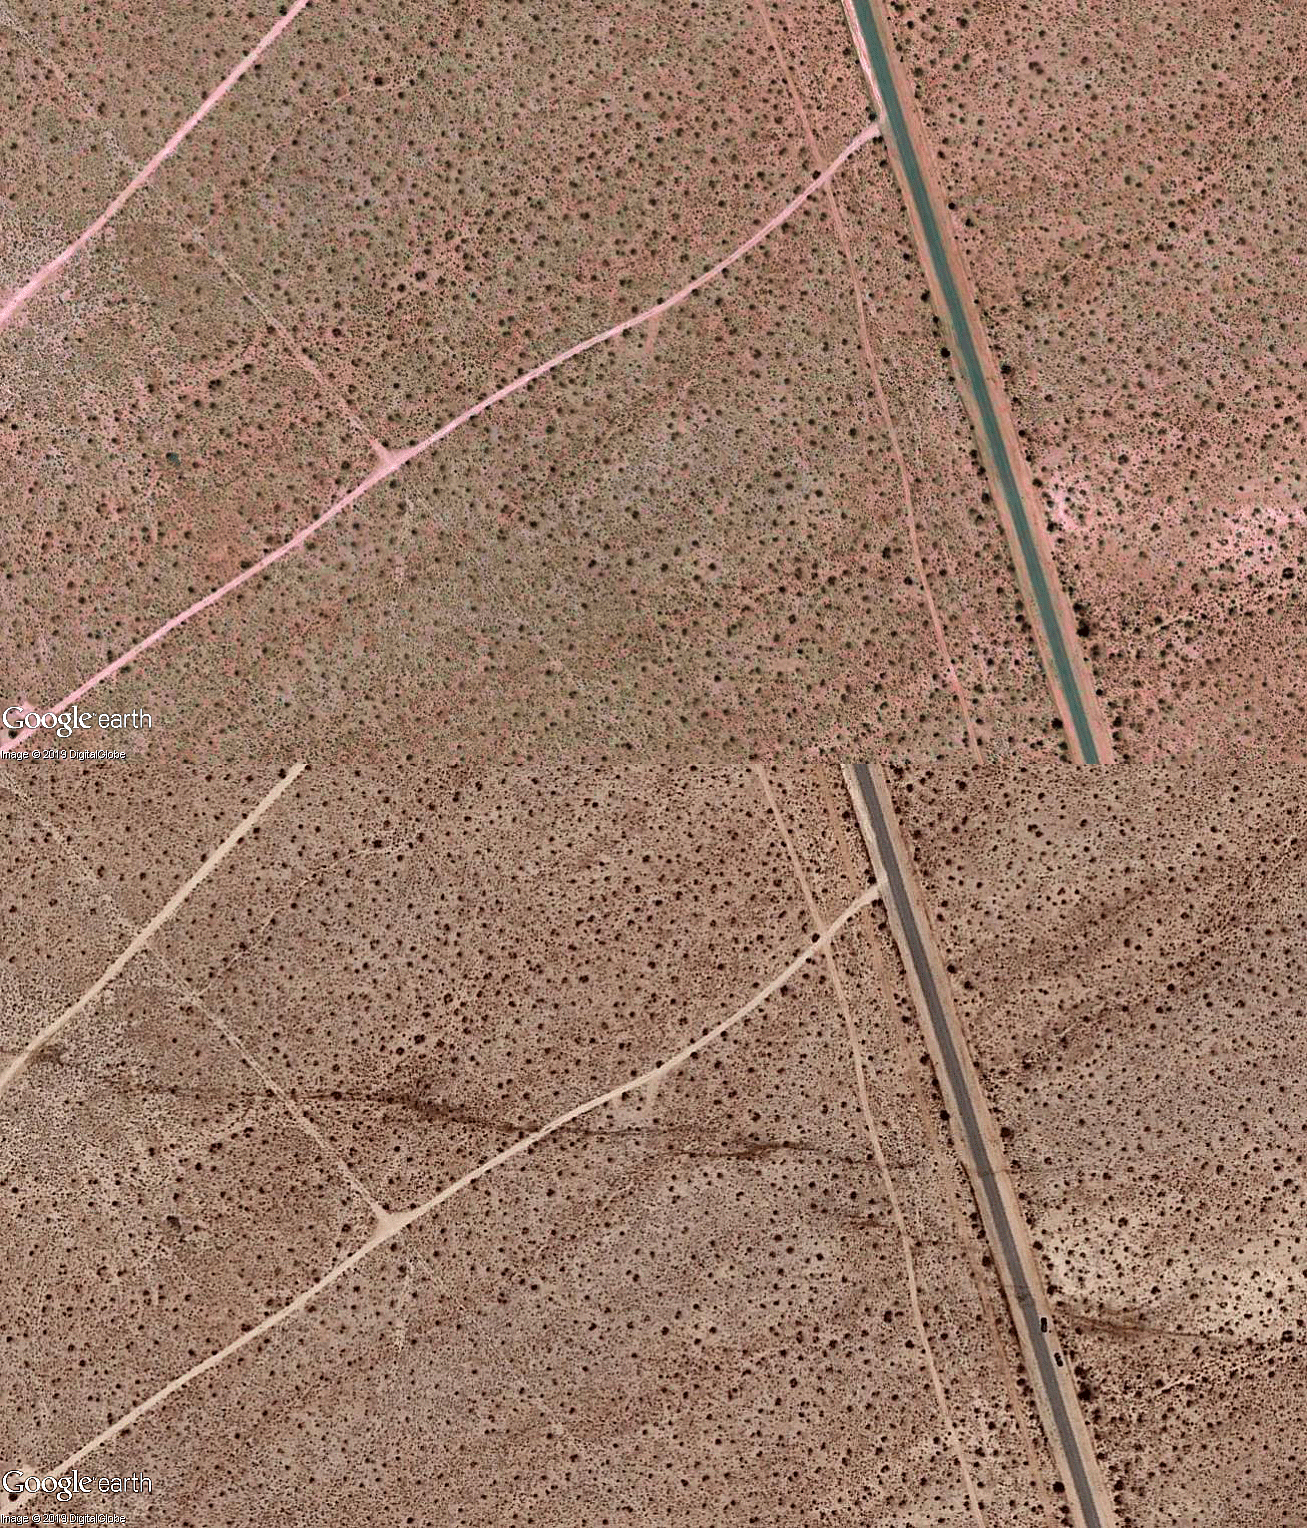
Some of the clearest images show long scars on the surface of the Mojave Desert, indicating precisely the 30 miles of earthquake fault — oriented in a northwest-southeast direction — that moved within moments on July 5.
“I’ve never seen this before,” said Brian Olson, engineering geologist with the California Geological Survey. “It’s really dramatic and a super-good illustrator, even for the advanced scientists, all the way down to the grade-school kids.”
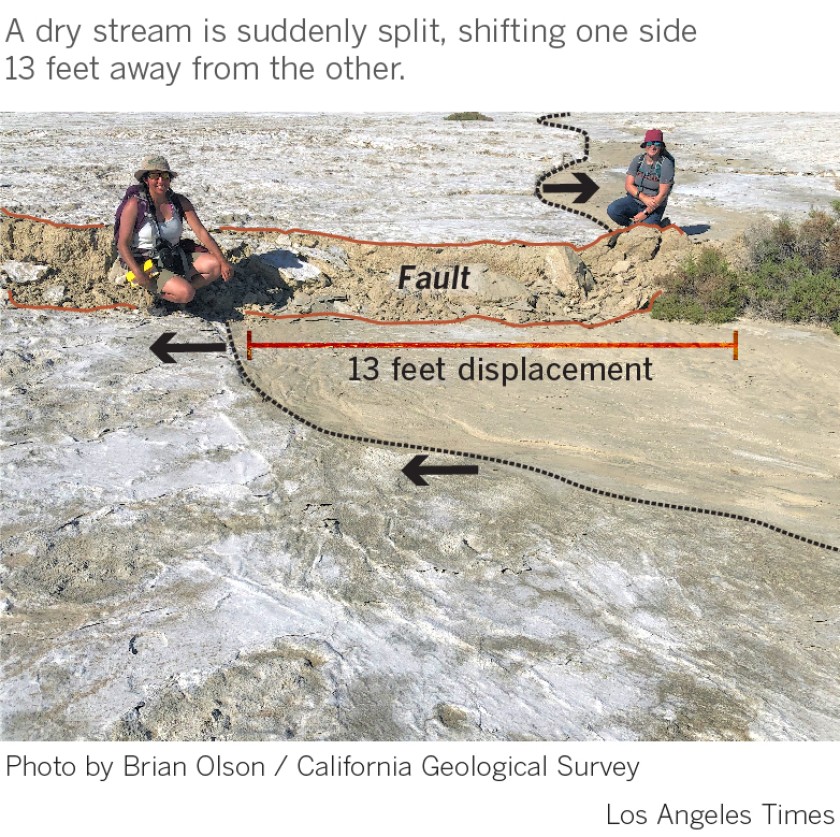
The images show “the scale of movement and the permanency of movement — this ground moved in places up to 13 feet, permanently. It’s not going back,” Olson said.
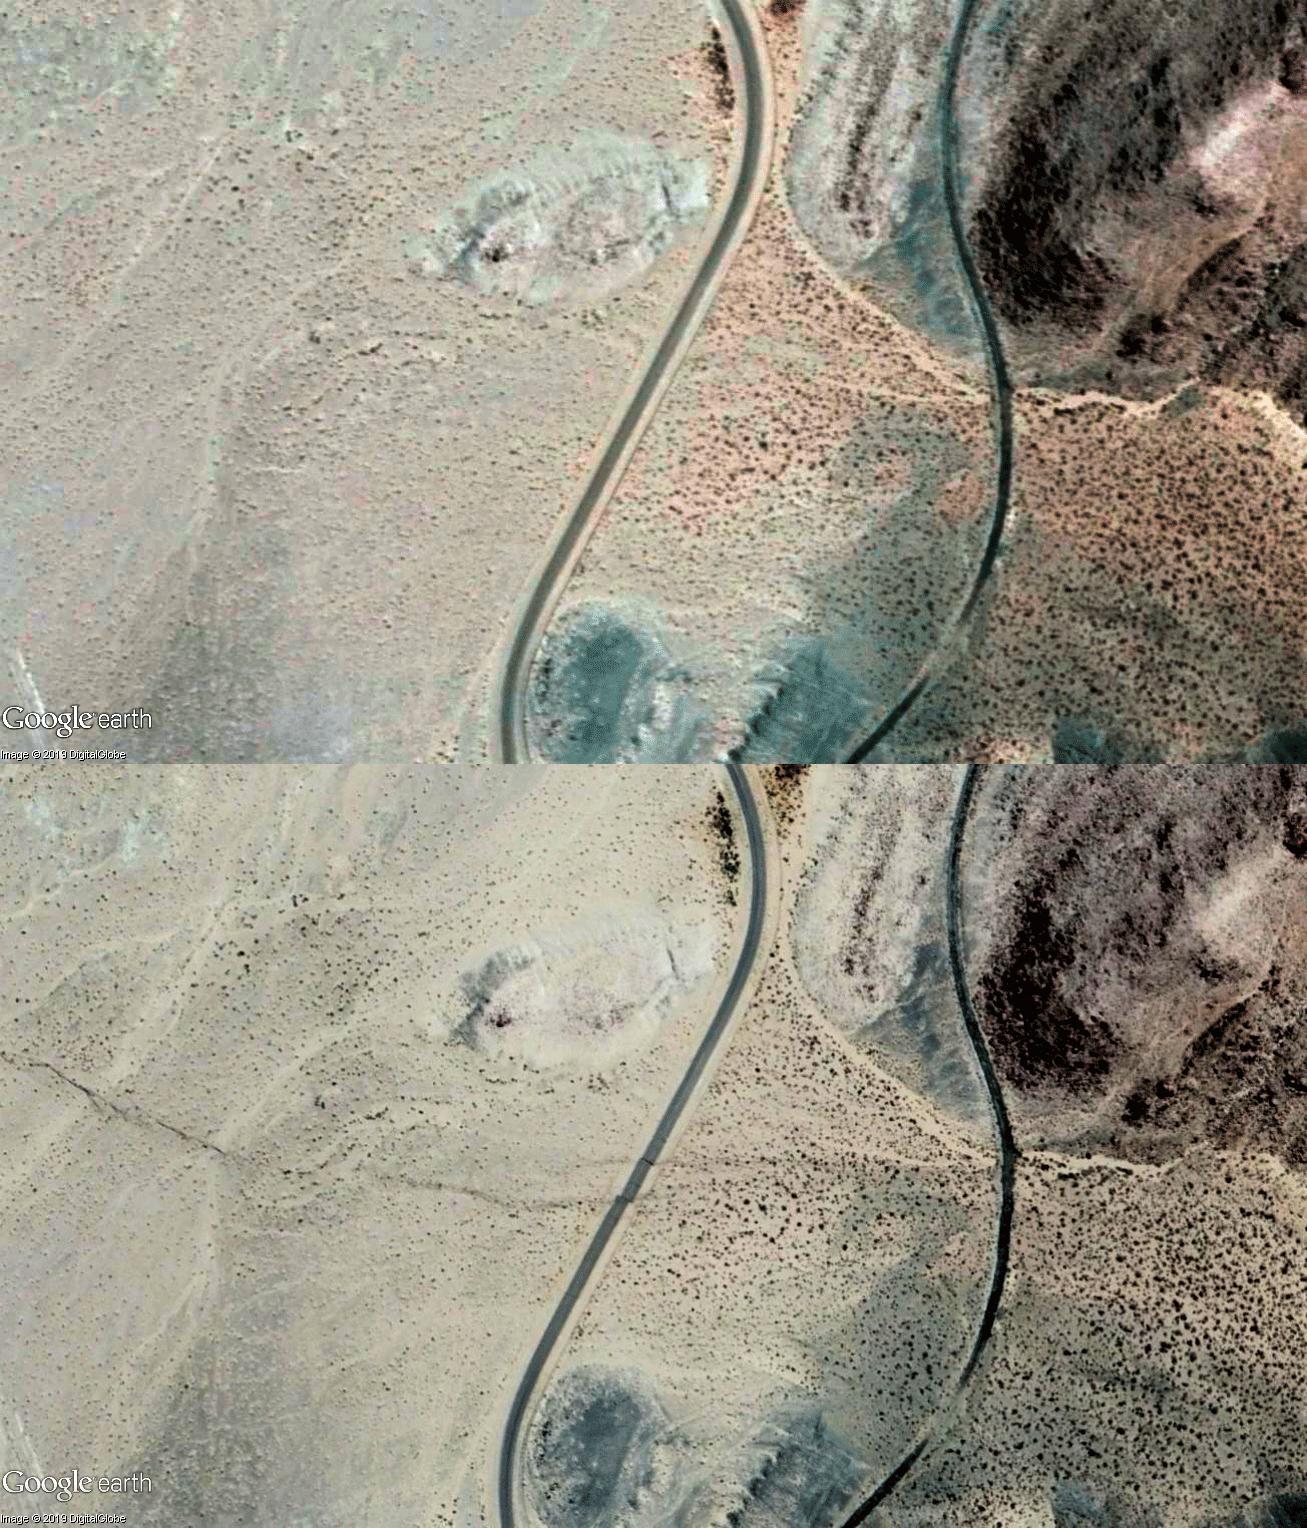
Some of the most widely circulated before-and-after GIFs that have been receiving attention by California earthquake scientists were created using imagery from Google Earth and DigitalGlobe by an earthquake geologist based in Greece, Sotiris Valkaniotis, who collaborates with the National Observatory of Athens. In a large section of the fault, images show how land on one side of the fault moved between 3 and 13 feet from the other side, Valkaniotis said.
A long crack in the earth created by the Ridgecrest earthquake of July 5. The dark stain is water leaking from a pipeline damaged by the fault.GIF: Sotiris Valkaniotis / Google Earth / DigitalGlobe The animations are an impressive example of what California has undergone for millennia. California sits on the edge of two gigantic tectonic plates, the Pacific and North American. A huge swath of California, from Santa Cruz to Santa Barbara, L.A. and San Diego, is moving northwest toward Alaska relative to the other plate, which is moving southeast toward Mexico. This kind of movement has been going on for millions of years. A famous example has been how the rock formations from a single volcano right on top of the San Andreas fault have slowly moved apart for millions of years. The western side of an ancient volcano is now in Pinnacles National Park east of the Salinas Valley; its eastern half is now 195 miles to the southeast, near the western Antelope Valley in Los Angeles County.
Huge ground deformation along a fault during the M7.1 ridgecrest earthquake.GIF: Sotiris Valkaniotis / Google Earth / DigitalGlobe California isn’t being just cleanly carved along the San Andreas fault. There’s a whole array of faults slicing up the state in ribbons, and the fault that ruptured in the Ridgecrest quake on July 5 was doing its job of moving the southwestern side of land from the fault toward Alaska.
The images are among the best of their kind in decades for California. For one, the earthquakes occurred in the desert — perfect to identify the trace of a moving fault without buildings or trees obscuring cracks in the earth. “It’s easier to identify,” Valkaniotis, in a telephone interview Sunday, said of seeing the fault rupture.
“There is no vegetation … aerially, there are no land-use changes,” he said. Similar efforts to do imaging by satellite for a strong earthquake months ago in Papua New Guinea were frustrated by the region being covered in tropical vegetation, obscuring the ruptured fault from view.
The fault responsible for the M7.1 earthquake in Mojave desert is instantly recognizable on satellite imagery.GIF: Sotiris Valkaniotis / Google Earth / DigitalGlobe The last two biggest and comparable quakes to hit the Mojave Desert in Southern California were the magnitude 7.3 Landers earthquake in 1992 and the magnitude 7.1 Hector Mine quake in 1999. But it would be years after those quakes before similar before-and-after comparisons were done, Valkaniotis said. And it was only about 20 years ago that the modern age of digital photography began.
Ground rupture was observed after the magnitude 6 Napa earthquake in 2014, but the ground displacements were much smaller, topping out at a maximum of 1½ feet, owing to the far less powerful nature of that temblor. The July 5 magnitude 7.1 Ridgecrest quake was 45 times more powerful than the Napa quake.
Darker lines show where the ground sharply moved during the M6.4 Ridgecrest earthquake in California.GIF: Sotiris Valkaniotis / Google Earth / DigitalGlobe The higher the magnitude, the greater the distance two sections of land can move away from each other in a quake. One famous example observed in the great magnitude 7.8 earthquake that leveled San Francisco in 1906 was at Point Reyes in Marin County, where a fence that intersected the fault was suddenly cut in two, separated on each side of the San Andreas by 18 feet.
A similar-sized quake along the southern San Andreas fault near Palm Springs would produce even greater fault movement. If a couple had the misfortune of holding hands across the fault in a remote part of the desert near Desert Hot Springs when a hypothetical magnitude 7.8 quake hit, they’d suddenly be separated by as much as 30 feet — almost the entire length of a city bus, U.S. Geological Survey research geophysicist Kate Scharer said in 2017.
Not all cracks in the ground seen after an earthquake are directly related to fault movement — sometimes, they can be caused by liquefaction or landslides, for instance. But in this case, there were plenty of cracks in the ground directly related to fault movement, Valkaniotis said.
The dark line is the fault that moved during the M6.4 Ridgecrest earthquake.GIF: Sotiris Valkaniotis / Google Earth / DigitalGlobeThe satellite images from the Ridgecrest quake match up with evidence of broken ground observed on foot. Olson has taken other photos on the ground that have similarly been dramatic. One is a two-lane road that crosses the fault; photos show the road has split and shifted 8 feet out of alignment.
Two-lane road crossing the fault is split and shifted by the earthquakes. Picture see caption Another is a dramatic photo of a dry streambed, in which its northern shore, at the moment when it crosses the fault, has now suddenly shifted to the north by 13 feet from its original path. “To be able to say this was flowing across this [fault] straight and, after the 7.1, it moved 13 feet north, and you’re just like, ‘Whoa.’”
The new sudden bend in the streambed is similar to earthquake-caused bends in streams in the East Bay along the Hayward fault and along the San Andreas fault at Wallace Creek in Carrizo Plain National Monument.
Stream is shifted by the earthquake fault. Picture see captionThe action of the fault illustrates how anything on top of it can be destroyed when the fault suddenly moves in a quake. Noting the broken 10-inch plastic pipeline that was shown on satellite imagery leaking water, Olson said, “imagine if it’s a 24-inch high-pressure gas line or a petroleum pipeline, or one of the fiber-optic cable networks that supply internet to the Los Angeles Basin….
“An earthquake is not only shaking and what the shaking does to buildings,” he said. “When you get to the level of the fault breaking the surface, it’s a smaller area affected — but the things affected can be critical for the community.”
Earthquakes vs infrastructures
The images also captured the attention of seismologist Lucy Jones, who has spent years warning about the damage expected where infrastructure crosses the San Andreas fault. “When infrastructure crosses faults, we know exactly where it will break,” Jones tweeted. One such trouble spot for Southern California is the Cajon Pass, the gap between the San Gabriel and San Bernardino mountains through which Interstate 15, the main route to Las Vegas, is built. Not only is it home to the San Andreas fault, but running through it is also a potentially explosive mix of pipelines carrying gasoline and natural gas, and overhead electricity lines. All it would take is for the fuel line to break and a spark to create an explosion that could result in a crater, according to a U.S. Geological Survey simulation of a magnitude 7.8 quake on the San Andreas. It is also plausible that, under certain conditions, a magnitude 7.8 earthquake could create such a sudden interruption of high-voltage interstate transmission of electricity that “potentially all of the western U.S. could lose power,” and restoring electricity in Southern California could take days.
earthquake vs water
Another concern is water. Los Angeles gets almost all its water from three major aqueducts, flowing from the Colorado River, the Owens Valley and the Sacramento-San Joaquin River Delta. But as they make their way into the region, the aqueducts cross the San Andreas fault a total of 32 times. Officials have long warned that a massive temblor on the San Andreas could destroy key sections of the aqueducts, cutting off the water supply for more than 22 million people in Southern California.
The Bay Area also has its own trouble spots, with water pipes and the BART commuter train tracks passing through the Hayward fault. Many homes in the East Bay lie directly on top of the fault. Some buildings, including old city halls in Hayward and Fremont, have already been abandoned.
earthquake vs buildings
At Memorial Stadium at UC Berkeley, seating was recently broken up and rebuilt in anticipation of a future earthquake on the Hayward fault that could move the facility’s western half 6 feet away from the other side.
Fault rupture has caused damage in other quakes, such as the 1971 Sylmar temblor. Lawmakers quickly passed a state law generally banning new construction directly on top of faults. The threat of destruction on top of faults is such a risk that some agencies have taken steps to vacate or demolish buildings directly on top of them. San Bernardino Valley College razed seven buildings along the San Jacinto fault in the 2000s; in 1991, Los Angeles Southwest College tore down two that sat on top of the Newport-Inglewood fault.
Implementation of the law has sometimes come with controversy. There’s an effort to build a $1-billion high-rise project in Hollywood; state geologists in 2014 identified an active strand of the Hollywood fault running underneath the property; city officials, however, have agreed with the developer that there is no active fault under the site.
With the potential of huge destructive quakes in California, building a huge skyscraper just on top of one of these faults is just irresponsable. Crazy. Be ready and get prepared for the next big one!
South African Weather Service issued severe weather warnings and watches for part of the country as an intense cold front, currently positioned SW of South Africa, is expected to make landfall overnight tonight July 22 into 23, 2019 with a second front following closely tomorrow. The cold fronts are expected to result in a significant drop in temperatures, windy and wet conditions as well as snow in the western and southern parts of the country.
Cold, wet and windy conditions will first be felt in the Western and Northern Cape on Tuesday, July 23 and will spread to the central parts of the country by July 24 with a significant drop in temperatures.
The fronts are expected to be accompanied by strong winds from July 22 to 24 over the Western Cape and central and western parts of the Northern and Eastern Cape Provinces.
These strong winds, reaching 65 - 75 km/h (40 - 46 mph), could lead to damage of settlements (both formal and informal), possible structural damage, especially temporary structures, interruptions to power utilities as well as an increase in travel times due to falling trees and reduced visibility due to dust storms. Susceptible roads could also be closed during this time, SAWS meteorologists warn.
This past weekend saw some snow reaching the ground in various highlying areas in the Western Cape. Further snow is expected once again in a similar area starting on Tuesday evening and possibly reaching more than 10 cm (3.9 inches) in places (Karoo Hoogland, Cederberg, and Langeberg). This could lead to icy roads and possible loss of vulnerable livestock as well as non-major passes being closed for a short period of time. The snow is expected to spread eastwards into the Eastern Cape by Tuesday evening reaching the Sneeuberg and the southern Drakensberg.
The rainfall will mainly be confined to the western and southern parts of the country (Western, Northern and Eastern Cape) and will clear by Thursday, July 25.
The bulk of the rainfall will occur in the western parts of the Western Cape on July 23 which could be heavy at times and lead to flooding of roads and informal settlements as well as cause major traffic disruptions. There is also a possibility of rockfalls and mudslides in places.
Cape Town weather warnings for July 23 (08:00 - 21:00 local)
Berg River and Redelingshuys: Flooding
City of Cape Town: Heavy rain
Drakenstein / Paarl: Heavy rain
Langeberg / Robertson: Heavy rain
Overstand / Hermanus: Flooding
Saldanha Bay / Langebaan: Flooding
Swartland / Malmesbury: Flooding
Cape Town weather watches for July 23 (10:00 - 22:00 local)
Cape Agulhas: Damaging winds
The coastline from Knysna up to Saldhana Bay: High Seas, up to 7 m (23 feet) tall
Theewaterskloof, Stellenbosch, Breede Valley and Worcester, Witzenberg and Ceres, Cederberg: Snow
Cape Town dams refilling
The storms will continue pushing Cape Town dam levels to impressive new heights in 2019. The last major cold front increased the combined dam level totals by 7%, The South African reports.
Just a few weeks later, the city stands on the verge of another bumper rainfall episode. Over the past seven days, the facilities have increased their water levels by 2.43%, taking them up to 63.83% full in total.
Cape Town is recovering from its worst drought in over a century and severe water crisis. This forced officials to impose strict Level 4 water restrictions on June 1, 2017, limiting residents to only 100 liters (26 gallons) of water per person per day. The measure also bans all use of municipal water for outside and non-essential use.
Cape Town is using 5 dams to collect its drinking water, and as of May 29, 2019 those dams, collectively, dropped to 19.7%. However, since the last 10% of that water is not usable, Cape Town's 4 million residents had only 9.7% of usable water left, less than 60 days of normal consumption.
The temperature in Anchorage, Alaska, soared to 90 degrees Fahrenheit on Thursday, shattering the city's all-time record-high temperature by 5 degrees. The previous record of 85 degrees Fahrenheit was set in 1969. It also shattered the daily record of 77 degrees for the Fouth of July, which had stood since 1999. Records in Anchorage date back to 1952.
Several other places in Alaska set all-time or daily records on Thursday.
While it was well above normal in Anchorage, the 90-degree temperature is not a first for the state of Alaska.
According to records kept by the National Weather Service (NWS), Alaska is no stranger to the 90s. In fact, way back on July 28, 1919, Fairbanks made a run at 100 when the mercury topped out at 99. Fairbanks has experienced 90-degree heat on several other occasions, most recently on Aug. 5, 1994, when it recorded a 93-degree temperature.
Other spots in Alaska have hit the 90s too, including McGrath, which had a 94-degree temperature as recently as June 17, 2013. Alaska has seen triple-digit heat at least once since record keeping began: In 1915, Fort Yukon, which is situated in central eastern Alaska, recorded a temperature of 100 degrees.And the sizzling temperatures will remain in the coming days. The heat dome that has set up across the far southern part of the state and brought the unseasonably warm conditions to Anchorage will surge northward into midweek.Temperatures will take a run at 90 degrees or higher across several locations across Alaska, threatening to shatter many daily record highs while some locations may topple all-time records.
"A strong area of high pressure has been nearly stationary and baking portions of southern Alaska recently, and it will gradually expand northward into midweek," AccuWeather Meteorologist Ryan Adamson said.
Highs will average 10 to 20 degrees above normal for this time of the year.The normal high temperature in Anchorage during early July is 65 degrees. Temperatures will continue to approach or crack 80 degrees through at least Monday."Saturday marked the fourth straight day of Anchorage setting a daily record high, and records will continue to be challenged through Monday," according to AccuWeather Senior Meteorologist Kristina Pydynowski.
As of Saturday, temperatures have reached or exceeded 80 degrees on six occasions in Anchorage this year. That is a record, according to Climatologist Brian Brettschneider."Smoke from wildfires to the north has filtered in Fairbanks," Pydynowski said. "While that should hold temperatures below records early this weekend, residents are dealing with worsening air quality."Bethel will not only break daily record highs early this week, but the all-time record of 88 degrees will be challenged.
"Anybody spending prolonged periods of time outdoors should be sure to drink plenty of fluids in order to stay properly hydrated," AccuWeather Meteorologist Kyle Elliott said.
Generally, rain-free days will be in store across the state. This will increase the threat for wildfires and also lead to poor air quality.
This is normally the warmest time of the year across Alaska as normal temperatures begin to decline by the middle of the month. While heat of this magnitude is common across the central parts of the state, it is not too common for it to become this warm along coastal locations. Warmer ocean temperatures off the coast have likely aided in this record heat.
While winds will remain generally light, firefighters battling the Swan Lake Fire in the Kenai Peninsula, south of Anchorage, will continue to battle hot and dry conditions this week.
A dense smoke advisory will remain in effect for the western half of the Kenai Peninsula through Monday morning.
Some people in an around Anchorage posted on Twitter to say that wildfire smoke wafted into town along with the high temperatures, and forced people to shut their windows. This in turn caused temperatures inside homes to rise.
In this photo taken Tuesday, July 2, 2019, and provided by the Alaska Division of Forestry, smoke rises from a wildfire in east Anchorage, Alaska. A fast-moving brush fire caused the temporary evacuations of a trailer home park and a science center in east Anchorage on Tuesday afternoon. Smoke from the fire raised a plume over Alaska's largest city that could be seen for miles. (Jason Jordet/Alaska Division of Forestry via AP)
Four other fires are ongoing across central Alaska, outside of Fairbanks, according to Inciweb.
"With vegetation continuing to dry out through the weekend, campers and hikers should be sure to thoroughly extinguish fires and cigarette butts to minimize the risk of sparking a wildfire," Elliott said.
The area of high pressure will lose some of its intensity toward the end of the week as it shifts over the Bering Sea. Temperatures will be trimmed back to more seasonable levels around Anchorage at midweek. Fairbanks and more of eastern Alaska will follow later in the week.
Download the free AccuWeather app to check on the latest forecast and temperature trends in your community. Keep checking back for updates on AccuWeather.com and stay tuned to the AccuWeather Network on DirecTV, Frontier and Verizon Fios.
On the morning of July 4, a magnitude 6.4 rocked Southern California, fracturing roads and sending people fleeing to safety. But that wasn’t all the Earth had in store: Less than a day and a half later, a powerful magnitude 7.1 temblor shook the region.
While earthquakes are not unexpected, the two most recent temblors are the largest that have struck this area in decades. And they promise to yield fresh clues about its complex geology.
The duo of quakes struck in what’s known as the Eastern California shear zone—an area east of the infamous San Andreas fault, where the Pacific Plate grinds against the North American Plate, creeping northwest at roughly two inches each year. The area extends from the southern Mojave Desert, up the eastern side of the Sierra Nevada, and into western Nevada. It’s crisscrossed by fractures in the Earth caused by the movement along the nearby tectonic plate boundary.
“The Eastern California shear zone is a really interesting area,” says Wendy Bohon, an earthquake geologist at the Incorporated Research Institutions for Seismology (IRIS). “How is it working? How is it accommodating plate motion? What are going to be the big structures that come out of this millions of years down the road?”
What happened?
The recent events are what’s known as strike-slip earthquakes, which occur when two blocks of Earth shift side-by-side, grinding past each other. They seemed to have occurred along the same set of faults, located in an area known as the Little Lake fault zone.
While no deaths or major injuries have yet been reported, the intensity of the ground movement was quite strong—enough to send goods flying off store shelves and buildings swaying. The shaking was also widespread, with reports of light ground movements as far as Chico, California, and Phoenix, Arizona.
Of particular interest in these quakes is that at least the first temblor seemed to have simultaneously broken two sections of faults that cut across each other at nearly a right angle. While such complex quakes are not unheard of, recent research suggests that they may be more common than once believed, explains Zachary Ross, a geophysicist at the California Institute of Technology.
“Historically, the thought has been that earthquakes occurred on individual faults,” he says. “And then over time, as the data has gotten better and better, we’ve started to realize that there’s potential for multiple faults to rupture for single events.”
Why shark attacks are more common in the Atlantic than the Pacific
This shift in thinking was propelled by the magnitude 7.3 earthquake that shook Landers, California, in 1992. This temblor fractured along at least five fault segments. Subsequent earthquakes have revealed similar complex breakage, including the magnitude 7.2 earthquake in 2010 in Baja California, Ross notes. This latest quake is further evidence that this complexity is common, even for smaller magnitude events.
Why did two big earthquakes strike?
In most circumstances, big earthquakes strike in a familiar sequence: There’s a large earthquake followed by a series of smaller events. That’s because the movement that occurs during a large earthquake causes increased strain in the surrounding region. Earthquakes are the Earth’s way of relieving this strain.
But in some circumstances, such as the recent pair of earthquakes in California, a relatively large temblor might just be the forerunner for even bigger event. While the difference between 7.1 and 6.4 may seem minor, magnitude is a logarithmic scale. An increase of a unit of magnitude is about 32 times more energy, which means that the second earthquake released roughly 11 times the energy of the first temblor.
Scientists think of this series of earthquakes as the foreshock, the mainshock or strongest event, and then the aftershocks, explains Susan Hough, a seismologist with the U.S. Geological Survey.“But it’s way too simplistic,” she notes.
Every earthquake causes a shift in the landscape, redistributing the strain in the crust, which means all earthquakes could trigger other earthquakes. “Whether or not an earthquake itself is an aftershock,” she says, “you can think of it as a potential [earthquake] parent.”
The likelihood that a big earthquake will trigger a larger event is roughly one in 20, according to Hough. That’s definitely a low risk. “But that one in 20 isn’t zero,” she says.
Scientists, however, are still untangling the connection between the recent events. The magnitude 7.1 temblor seemed to break along the the northwest-southeast limb of the pair of faults that ruptured earlier, Hough notes, extending farther than the first quake in both directions.
“Major scientific questions: Did part of the fault break and then break again? How did breaks compare in detail?” she writes on Twitter. Finding the answers to these questions could have important implications for understanding the hazards of these events.
“This appears to be the clearest case I've seen that that did indeed happen,” she says of the same fault rupturing more than once in a short time period. “But much work is needed to sort out the details.”
What’s going to happen next?
So far, many more than a thousand aftershocks have rippled through the region. While the frequency and intensity of subsequent temblors will wane, Southern California likely has more shaking in store. “A magnitude 7 is going to produce activity for years,” Ross says.
The USGS estimates that over the course of the next week, between 240 and 410 earthquakes of magnitude 3 or higher will likely ripple through the region. These are events just large enough to feel if you are positioned close to their epicenter. As for larger earthquakes, the probability becomes increasingly small, but not out of the question.
The USGS estimates that there’s a 24 percent chance that as many as two earthquakes magnitude 6 or larger could strike in the next week. But as scientists continue to analyze these events, they may adjust those numbers.
Such a strong series of aftershocks is not unexpected. “Earthquakes out in the Mojave Desert traditionally have these bigger, robust aftershocks sequence,” Bohon says.
She cautions, however, that all of these probabilities are forecasts and not predictions. No one, despite what some claim, can predict future earthquakes. She likens the difference to weather forecasts, which are an estimate of the probability that something might happen.
“You would never predict the weather,” she says. “You can’t predict with 100 percent certainty that it [will be] raining unless it’s raining. And earthquakes are very similar.“
Bohon emphasizes that it’s normal to be scared during an earthquake, which can rock the ground like a boat in rough water. But as aftershocks ricochet through Southern California, she suggests people who live in earthquake-prone regions check how prepared they are for the next event.
“This was a good scenario earthquake,” says Bohon. “It was in a fairly unpopulated area, but a lot of people felt it.” Bohon hopes that means those who experienced it are getting ready for the next one.
“It’s okay to be scared,” she says, “but we also have to be prepared.”


 (
(